PERSONAL CODING &
TECH PROJECTS
I present an array of personal projects that serve as self-driven learning experiences to further the understanding and application of computer science and computer-aided design software, or to learn new ways to connect communities. I chose to specifically utilize unique APIs and data assimilation techniques to crate projects across various disciplines.
PictureToSphere: A way to 3D Print Panoramas in a Sphere
Summary
Inspired by the Reddit post to the right, I thought it would be cool to replicate this ability using 3D Printing. With a toolchanger printer and FullSpectrum software, it is possible to generate a decently comparable result in an additive manufacturing environment.
The project is a frontend application that processes the image as a series of 3D printable 'colors' and places it onto a sphere, which can be changed in size and visualized before downloading a file to pass through the slider.
.
Key Features
- Sphere Diameter: Flexible sizing controls supporting both Metric (mm) and Imperial (in) units.
-
Layer Height Optimization: Real-time adjustment of layer height (from 0.04mm to 0.6mm), which directly influences the color blending logic used in the final print.
-
Hollow Shell & Pedestal Logic: Toggle between solid or hollow volumes with adjustable wall thickness, and generate custom-sized display pedestals integrated into the export.
-
Custom Palette Engine: Users can define a physical inventory of 2 to 5 filament spools. The app includes an "Auto-pick" feature that analyzes the uploaded image to select the best matching colors from a user's stored inventory.
-
FullSpectrum Color Blending: Beyond physical colors, the system calculates up to 120 "virtual" colors created through layer-alternation recipes (e.g., swapping filaments mid-layer to create intermediate shades).
-
Calibration & Overrides: Support for manual hex-color overrides to ensure the digital preview matches the real-world results of specific filament brands.
-
Interactive 3D Preview: A Three.js powered viewport allowing users to orbit, zoom, and inspect the sphere under different lighting conditions ("Day" vs "Night" modes).
-
Multi-Mode Views:
-
Original Sphere: Displays the raw image texture.
-
Slicer Color Map: Shows the quantized results, previewing exactly how the slicer will interpret the colors.
-
Print Preview: Simulates the final physical object, accounting for layer-stacking effects and filament coverage.
-
Flat Map Mode: A 2D projection view useful for precision image alignment and prime meridian/equator positioning.
-
-
Coverage Analysis: Displays a live breakdown of filament usage percentages, helping users estimate material requirements.
-
Orca/Bambu 3MF Support: Generates specialized 3MF files with per-triangle paint_color assignments, allowing multicolor slicers to instantly generate toolpaths without manual painting.
-
Printing Orientation Intelligence: An "Auto-Orientation" feature that analyzes the mesh to find the angle that minimizes color transitions, effectively reducing print time and waste.
-
Hemisphere Splitting: Ability to export the model as two separate halves for easier printing on machines without complex support structures.


Spring 2026
CMU Bus Sign Part 2: Implementation
Summary
Years after proposing my design to a board at CMU, I heard no traction. Little did I know that one of my fraternity brother's friends saw my sign on the first floor and would begin to develop a team at ScottyLabs in 2025 to design a more polished version of the Bus Sign.
I caught wind of the project through a friend and contacted ScottyLabs to see if I could be involved. After communicating with the team on the Discord channel, I became one of the lead UI/UX developers for the screen, where I was able to apply feedback directly from Cohon University Center and Carnegie Mellon University administrators to generate unique, dynamic, and visually appealing designs.
By utilizing CMU's design language with a direct focus on making sure information was easily accessible on the screen, I was able to come up with the design provided in the bottom right, which is intend to be placed in the Lobby of the Cohon University Center in Q3 2026.
Some of the features I thought of adding are:
- Clear display of bus crowdedness
- Dynamic buses passing through at key time marks (X:X5, X:00...)
- Common naming alternatives for different bus stations (to/from downtown, toward/from <street>)
- Current date/time
- Visual Cues related to Soon Now, including flashing background and text
- Bus quantity overflow using 'next busses'


Spring 2026
Proof of Concept: SpottedSpectrum: Custom OrcaSlicer Fork for Mixed-Filament G-code Generation
Summary

SpottedSpectrum is a custom fork of Snapmaker Orca / OrcaSlicer focused on experimental mixed-filament slicing workflows. The project modifies the slicer to support custom intraline filament patterns between two selected filaments.
Key features include:
-
Custom mixed-filament rows using two selected physical filaments
-
Intraline pattern controls for segment length, distribution mode, minimum run length, random seed, and random variation range
-
Multiple pattern modes, including random, equal-size aligned, and equal-size brick-style distribution
-
Preview swatches that visually represent the selected mixed filament pattern
-
G-code generation that separates pattern segments into filament-specific toolpath buckets to reduce excessive filament changes
-
Preview support for displaying the generated multi-filament output
-
Custom branding and executable naming as SpottedSpectrum
-
Custom application icon with black-and-white spotted styling for visual distinction from the original slicer
The current state of the code is not sufficiently developed to make it usable for actual 3D printing but rather acts as a tool to get more professional C++ developers to initiate their developments on the topic if it is perceived by the community as a good idea. The project can be expanded to include:
-
More filament colors per line
-
Avoidance of complications related to overhangs or non-supported layers
-
Smarter toolpath ordering to reduce travel moves and filament swaps
-
Better preview visualization for mixed and intraline filament regions
-
User-defined pattern presets for gradients, speckles, and brick-style layouts
-
Adaptive patterning based on wall thickness, nozzle diameter, or feature size
-
Support for different patterns on walls, infill, top surfaces, and bottom surfaces
-
Performance optimizations
Purpose
While I was using Full Spectrum with my Snapmaker U1, I noticed that colors appear to go across the object and can sometimes look striated. While they can be resolved with the correct filament, I thought of a potenital solution that may work: intraline color changes.

Spring 2026
BirthdaySpacePoster: Websinte to Purchase Astronomy Picture of the Day Posters
Summary
This project is a full-stack NASA Astronomy Picture of the Day (APOD) poster generator that creates high-resolution, print-ready space posters from any date since June 16, 1995.
Users enter a date, and the app automatically pulls APOD content, composes a polished poster layout, and prepares files for digital download and physical print checkout.
Key features include:
-
Date-based APOD retrieval and parsing (title, image, explanation, credits)
-
Auto-generated poster composition with consistent 2:3 print layout
-
Visual enhancements using astronomy metadata (moon phase, meteor shower season, sunspot/space context cues)
-
Palette-aware styling extracted from each APOD image
-
Multi-format export flow (SVG/PNG/JPG variants for web and print)
-
Stripe-based checkout for digital and physical products
-
Printful shipping quote + fulfillment workflow for physical poster orders
-
Post-purchase download flow with session verification and UX safeguards
Purpose
I built this project to combine two interests: space education/aesthetic design and automated digital product creation.
The goal was to turn NASA’s daily astronomy archive into a user-friendly poster creation experience where anyone can generate a meaningful, personalized print from a specific date.
This also serves as a technical exercise in building a production-style pipeline end-to-end: data ingestion, visual generation, export tooling, checkout, and fulfillment.
Long-term, it supports a scalable model for passive-income poster sales while still being a creative project I genuinely enjoy.


Winter 2025/2026
DoomsdayDirections: Risk-Aware
Route Planner!

Summary
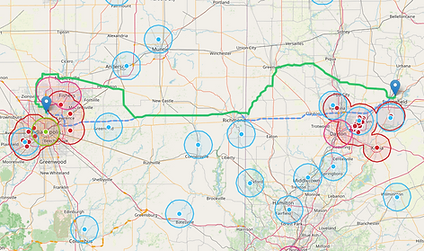
DoomsdayDirections is a browser-based mapping tool that generates safer driving routes between two points by avoiding user-selected risk zones.
It combines OpenRouteService routing with OpenStreetMap/Overpass hazard data to build custom avoidance boundaries around categories like military sites, airports, ports, power plants, major city centers, state capitals, and major highways.
Users can select threat profiles, tune avoidance radii, and compare baseline vs adjusted routes with distance/time deltas and turn-by-turn steps.
The app also supports route sharing/export (email, SMS, print/PDF), map-theme switching, and live hazard overlay previews based on the visible map area.
Key features include:
-
Address geocoding and map click location picking
-
Baseline vs safer route comparison with route metrics
-
Category-based hazard overlays with adjustable radii
-
Highway-avoid routing mode + polygon-based avoid zones
-
Auto fallback logic for ORS limits (segmented routing + lighter avoid sets)
-
Live map preview refresh with non-blocking background updates
-
Share/export flow (email, SMS, print/PDF)
-
Preset and custom threat profile support
Purpose
I built this project as a practical geospatial routing exercise focused on decision-making under constraints.
The goal was to create a customizable route-planning tool where users can define what “risk” means to them, then generate routes that reflect those assumptions.
It also served as an end-to-end engineering project for handling real-world mapping problems: external API reliability, geometry constraints, fallback routing logic, and UX performance during continuous map interaction.
Winter 2025/2026
MusiPoster: Website to Create Your Own Playlist/Album/Song Poster!
Summary
MusiPoster is a full-stack web app for creating customizable, print-ready posters from Spotify playlists, albums, and songs.
-
Spotify OAuth integration lets users authorize and pull real metadata/artwork directly into the editor.
-
Supports three content flows: Playlist posters, Album posters, Song posters
-
Auto-populates key content fields, including:
-
Title
-
Artist/author
-
Track list
-
Metadata (release date, total length, track count, genre, label where applicable)
-
-
Advanced editor customization includes:
-
Font family selection
-
Title/artist/meta/song size controls
-
Color controls (background, primary text, accent text)
-
Palette extraction from artwork
-
Palette shape/placement/order/spacing controls
-
Lyrics mode and column controls (for song posters)
-
Track formatting options (separators, split/wrap behaviors, style variants)
-
-
Alignment and layout tooling includes:
-
Drag/reposition for editable groups
-
Multi-element selection
-
Alignment actions (left/right/top/bottom)
-
Lock/unlock per element
-
Selection bounds and adjustment controls
-
-
Export and file output:
-
SVG, PNG, JPG, PDF
-
Adjustable raster output size for PNG/JPG
-
Settings JSON export/import for reproducible edits
-
-
Purchase/download flow includes:
-
Stripe checkout integration
-
Session verification
-
Success-page ZIP download flow
-
Auto-redirect to home after download starts
-
-
Reliability and UX features:
-
Font-preservation work for export paths
-
Error toast/banner feedback in edit flow
-
Preview and success-flow UI refinements
-
Footer links for support and donations
-


Purpose
MusiPoster was built to make allow users to customize and purchase/print their own posters.
Unfortunately, due to Spotify's new rules on their API, this project is unlikely to be as efficient as shown in the video but can still be accessible and usable through non-API methods.
Winter 2025/2026
NASA's Astronomy Picture of the Day Posters
Summary
This program is written in Python and creates a poster when provided a specific date past June 1st 1995. It uses a variety of public databases and websites to gather important information required for the poster, then parses and organizes the information to be aesthetically pleasing and generalized across size and shape and length of content.
I intend to use an automation program to automatically upload to Redbubble without any user input. I may also create a store on Wix with Printful.
Purpose
I recognized that posters are a simple method to generate passive income, as the development of the posters is relatively consistent across pictures, and companies have organized the printing and shipping automatically.
This combined with my love for space led to this passion project.


Fall 2025
Secondary Car Screen: Interdisciplinary Project
Summary
I have developed a secondary car screen that utilizes the following features:
Hardware:
- Raspberry Pi Model 3B as computer board with Battery UPS HAT
- ~7 inch Widescreen as monitor
- Webcam
- 3D-Printed Station to house all (or most) components
- Integration with Cigarette Lighter adapter (not fusebox)
Software:
- [Functional] Pull origin from private Github repository (for on-the-go updates without removing Pi from setup)
- [Functional] Gracefully shutdown when car turns off (to mitigate SD corruption risk)
- [Functional] Show Date, Time, and Weather
- [Functional] Show Lyrics and song progress for currently-playing Spotify song
- [Functional] Show and record dashcam footage for Accident Protection
- [Functional] GPS Integration for Speed/Weather accuracy
- [In development] Computer Vision integration for lane centering, traffic light detection, and/or car distance monitoring
- [Future Development (not possible using current technology)] Integration with Waze/Maps to show next step in Directions
- [Future Development (possible but unlikely)] Integration with OBD-II to display car information
- [Future Development (possible but unlikely)] Integration with touchscreen or trackpad for passenger input

Purpose
I have been wanting to do this project since I got into coding, and recognized it would be a huge challenge. At the time, I did not have a job nor have the experience to know where to being with this project.
However, as I continued to grow into the computer science and computer engineering space, I felt confident that I would to find, buy, and integrate resources to pursue this project. Within a few weeks, I was able to generate a software prototype integrated into the Pi, and feel confident that the current setup will integrate into my car nicely.


Fall 2025
Boarding Pass Designer
Summary
Given a series of inputs from a CSV/Excel document, this can create multiple boarding passes containing information like Location, Name, Gate Number, Airline, and plenty more! This is put into a PDF which can be printed and cut out.
Purpose
For a present for my girlfriend, I created the "Boarding Pass Binder", which takes all of the places that we have been (with pictures) and put them in a binder for us to continue to track the countries, states, and cities we have been to. This program allowed me to expedite the creation process by bulk-producing the tickets while still creating a unique and loving gift.


Fall 2025
Chrome Extension: Autofill Anywhere
Summary
Chrome Extension that allows the user to preset options on a form website then automatically fill presets at the click of a button.
Purpose
When my girlfriend was starting her Rotational Year for her Physician Assistant school, she was requested to fill out a webform on "Typhon" for every patient she sees. Some of the form's questions are consistent for each patient and for each rotational specialty, and repeating the form questions that are repetitive adds significant amounts of time to her patient logging.
She requested that I create a tool to simplify the process, and thus a Chrome Extension was born! I thought of generalizing the process to apply this to any form across the web.
Fall 2025


Website: Build Your Own
Design Traceability Matrix
Summary
This tool is an interactive, browser-based application for creating and managing Design Traceability Matrices. It allows users to define columns such as User Needs, Design Inputs, Design Outputs, Verification, Validation, and Risks.
Within each column, users can add individual traceability items and link them together using arrows that represent logical relationships across development stages.
The application also supports importing/exporting data in JSON format, viewing details and connections of each item, and managing multiple matrix projects through a tabbed interface.
It is particularly useful for teams working on regulated product development to ensure complete and transparent traceability.
Purpose
At EHOB, I recognized that our ability to trace out Design process was quite limited. While Google Sheets were effective for our early stage development, as we continue to be more thorough in our Design Inputs and Design Verification, having a more robust tool was going to be helpful.
While this was not implemented at EHOB as:
- extensive program validation would be necessary
- errors could not be fixed by myself as fast as they would present themselves
- The program would not track user updates in a traceable way, thus not making it ISO 13485 compliant...
I took this as an exercise to see if I could make something that could achieve the high level goals of a Medical device company

Empty Template

Filled in DTM (ChatGPT generated for Incontinence pad)
Summer 2025
Chrome Extension: Smart Reply
Summary
Chrome Extension that allows the user to use Google's Writer API to send replies to inbox emails using LLM's through Microsoft Outlook Online.
In its current state, there is customizability in:
- prompt
- coworkers' names/professional titles.
- light vs. dark mode of interface
Purpose
With Large Language Models becoming more prevalent in the workplace, as they allow more complex tasks to be completed more efficiently, I decided that I should improve the speed at which email replies are being executed by incorporating LLMs into them.
While other Chrome Extensions do this, they generally have a small free trial period which limits their application. I wanted an option that would have nearly limitless quantities of uses.

.png)

Summer 2025
Conference Room Free/Busy Screen
Summary
This program, written in Python, connects to Microsoft Outlook to fetch and display the availability of a conference room by analyzing its free/busy schedule. It uses a GUI to show the room's current status, upcoming meeting times, and time remaining until it becomes free or occupied.
I created a successful proof of concept and worked on designs in Figma. As presented, the goals are to add meeting details and additional frames.
Purpose
At EHOB, we have two conference rooms, and we were unaware if the rooms were booked or free becuase there was no visual indicator.
I created this project as a potential non-enterprise solution to visualize the free/busy status of the room at any point.
Libraries and Programs Used
win32com, tkinter, Figma

_edited_.jpg)
Working Proof of Concept (left), Figma Designs (above), Interactable Prototype (below)
Winter 2024/2025
Album Poster Generator
Summary
This program is written in Python and creates a album poster when provided a album title or Spotify Album ID. It uses the Spotify API to gather important information required for the poster, then filters and organizes the information to be aesthetically pleasing.
I also created a program that uses pyautogui to automatically upload to Redbubble without any user input.
Purpose
I recognized that posters are a simple method to generate passive income, as the development of the posters is relatively consistent across artists and companies have organized the printing and shipping automatically.
Libraries Used
spotipy, pynput, pyautogui, tkineter, PIL, datetime, colorthief


Describe your image


Winter 2024/2025
PPTX to DOCX Convertor
Summary
This program, written in Python, is designed to help users create outlines directly from the text of a Microsoft PowerPoint or Google Sheets presentation. It takes the title blocks and bullet points from the slide body to organize the information into an outline that is exportable into Google Docs, Microsoft Word, or a flashcard software like Remnote.
Purpose
When my girlfriend was studying for Physician Assistant school, she would spend hours copying and pasting the lecture slides textboxes into Remnote, a popular space-time repetition software.
Because of the hours this software saves for students, I decided to make the product available for users at a reasonable price point, and is available on Payhip below.
Libraries Used
python-docx, python-pptx, tkinter
Summer 2024
Website: Multiple Distributions Grapher
Summary
This website is written in react.js and is designed to help users complete and compare datasets using basic statistics. This website allows users with the following:
-
Calculate Averages and Standard Deviations
-
Determine outliers
-
Classify datasets as from the same population or not (T-Test)
-
Determine the likelihood of values occurring within a threshold
-
Plot Distributions when Mean and Standard Deviation are provided
-
Plot Distribution when the data is provided.
Purpose
During my first few months at EHOB, I recognized that data analysis for lab experiments was important, yet online tools did not allow me to compare multiple datasets simultaneously. I created this website to help aid my team in viewing multiple datasets in one cohesive image.

Summer 2024
Chrome Extension: JobHarvest

Summary
JobHarvest is your Gmail to Google Sheets pipeline for your job search! The extension parses your job alert emails and allows your to filter and copy for your Job Search spreadsheet
This extension parses your email to look for Job Alerts from major Job Boards. It will then compile the data and provide a table to copy and paste into or directly send to your spreadsheet.
Future versions will improve breadth of preferences and job alert email types and an automatic email-to-sheets pipelining.

Fall 2023
Lyrics Data GUI
Summary
This Python script integrates with Spotify to create a graphical user interface that displays playback details, including the song, artist, and progress. It continuously updates the GUI with real-time information about the currently playing song, along with synchronized lyrics. It has the option to play/pause, rewind, or fast forward directly from the GUI.
Purpose
I listen to music while showering, but would like to view song lyrics without damaging my phone. This project is the first step to making a screen in the shower that would show me the lyrics.
Libraries Used
Customtkinter (nicer-looking tkinter), spotipy, datetime, lyricsgenius, syncedlyrics

Fall 2023
Morewood Monitor
Summary
While at CMU, I was given a series of computers that were not being used by the University. I used one for my personal projects, and the other for my fraternity, AEPi.
This computer was used for Booth, but was ultimately delegated to the Morewood Monitor. The Morewood Monitor was a Pledge Project for the class that I was the Rush Chairman for -- creating a program that can read the stoplights at the corner of Forbes and Morewood and predict when the light will turn green. When my peers leave AEPi, they will be able to time their exit such that they minimze their time in the cold by crossing the street right when the walk sign lights up.
After this project was unsuccessful during the Pledge Program, the computer was repurposed for the screen you see on the right.
The Morewood Monitor featured the following items 24/7:
- Date, Time, and Temperature of current day
- AEPi Calendar events (Google Calendar API)
- Next buses and their times for the nearby bus stops (PGH Bus API)
- Kitchen Cleaning Duties (Google Spreadsheet API)
- Half off Jake Shake (NHL API
- Phone Number of Fraternity Chef and myself
This was used and up-kept by myself until a liquid spill destroyed the computer. Its positive impact on the AEPi community will be remembered.

Spring 2023
Lapse Terra - Automatic Youtube Uploader
Summary
This Python script takes in videos created by other models and automates the timing and release of these videos to a YouTube channel. This script enhances each video with background music and incorporates tags, titles, and descriptions for each video type.
Currently, the Youtube Channel has released or is releasing videos of
-
Sun Timelapses from the past Week/Month
-
Regional Satellite Cloud Timelapses from the past Week/Month
-
Semi-globular Satelitte Cloud Timelapses (GOES and Himawari Satellites)
-
Space Station Timelapses
-
Probability of Aurora and Earth's Magnetosphere (active)
-
Daily Random PubMed Article Summary (inactive)
-
Billboard Top 10s (inactive)
Purpose
In the pursuit of streamlining content creation, I leveraged Python scripting to automate the generation and uploading of videos on YouTube. Focused on disseminating insightful content effortlessly, this script minimizes manual effort while contributing valuable insights to a wider audience.
Libraries Used

simple_youtube_api, datetime, cv2, moviepy
Fall 2022
Email Scraping - Expenses and Job Search
Summary
This Python script systematically gathers and processes job and expense-related information from emails. It classifies incoming messages by sender domains, such as LinkedIn or Glassdoor for job search and Venmo or my bank account for expenses, and then extracts pertinent details like sender, subject, or quantity paid. Specifically tailored parsing mechanisms are implemented for each sender type to ensure accurate extraction of information and is then placed in Google Sheets spreadsheet. This helps automate the tracking of my expenses and automate my job search using the pre-determined email alert systems utilized by most companies.
Libraries Used
google, googleapiclient, beautifulsoup, datetime

Summer 2022
Jake Shake Twitter Bot
Summary
The Milkshake Factory offers a deal during the hockey season that if Jake Guentzel, Pittsburgh Penguins player, scores during a game, "Jake Shakes", one of their popular milkshake flavors, are half off the day after. This Python script checks the recent goals scored by the NHL player Jake Guentzel by scraping the relevant information from the official NHL website. The script then evaluates whether Jake Guentzel scored a goal the day before and, posts a tweet indicating that Jake Shakes are half off today.
Purpose
In my fraternity, AEPi, there was a tradition to get the promotional shakes whenever Jake Guentzel scored. I developed a program to inform us of the discount.


Libraries Used
Datetime, pandas, requests, tweepy
Spring 2022
Bus Stop Data GUI
Summary
This Python script creates a graphical user interface to display real-time information about the bus prediction times for a specific Pittsburgh bus stop. It uses the Port Authority BusTime API to fetch predictions for the designated bus stop and organizes the retrieved information, continuously displaying and updating the bus routes along with their respective arrival times on the GUI.
I created a Proof of Concept version that I used for myself, then created prototypes in Figma.
I presented this to a group of people at Carnegie Mellon University in charge of construction and campus projects, but was not requested to pursue further due to complications in costs and manufacturing.
Purpose
I was living about 1 mile from campus during my graduate semester and wanted to ensure I was not late to my classes. This screen helped me plan my morning, including what clothes to wear and which busses helped me get to my location.
Libraries and Programs Used
pghbustime (Port Authority BusTime API), tkinter, requests, datetime, Figma

Working Proof of Concept (left), Figma Designs (below)


Spring 2022
Dynamic Top 10 Chart Visualizer
Summary
This Python script dynamically generates animated line graph videos illustrating the changing rankings of the top songs on the Billboard Hot 100 chart for a given period of time. Through a systematic process of data retrieval, processing, and visualization, it produces an MP4 video, where each line corresponds to a song and its movement signifies shifts in rank. The script introduces an element of randomness by allowing the creation of videos for different time frames such as years, seasons, or quarters, enhancing the diversity and unpredictability of the generated visualizations.
Purpose
Recognizing the expansive potential of the Billboard dataset, and looking for additional videos to post to my YouTube channel, I devised a script to convert Billboard data into compelling video content.
Libraries Used
billboard, pandas, and bar_chart_race
